Chronic heart disease
Intervention: a reduction in CHD incidence
Note
In this example, we will also use components from the
vivarium_public_health.mslt.disease module.
Compared to the previous simulation, we will now add a chronic disease component, and replace the all-cause mortality rate intervention with an intervention that affects CHD incidence.
To add CHD as a separate cause of morbidity and mortality, we use the
Disease component:
components:
    vivarium_public_health:
        mslt:
            disease:
                - Disease('CHD')
We then replace the ModifyAllCauseMortality intervention with the
ModifyDiseaseIncidence intervention.
We give this intervention a name (reduce_chd) and identify the disease
that it affects (CHD).
In the configuration settings, we identify this intervention by name
(reduce_chd) and specify the scaling factor for CHD incidence
(CHD_incidence_scale).
components:
    vivarium_public_health:
        mslt:
            intervention:
                - ModifyDiseaseIncidence('reduce_chd', 'CHD')
configuration:
    intervention:
        reduce_chd:
            # Reduce the CHD incidence rate by 5%.
            CHD_incidence_scale: 0.95
Finally, we add an observer to record CHD incidence, prevalence, and deaths,
in both the BAU scenario and the intervention scenario.
We use the Disease observer, identify the disease of interest by name
(CHD), and specify the prefix for output files (mslt_reduce_chd).
components:
    vivarium_public_health:
        mslt:
            observer:
                - Disease('CHD')

configuration:
    observer:
        output_prefix: results/mslt_reduce_chd
Putting all of these pieces together, we obtain the following simulation definition:
plugins:
    optional:
        data:
            controller: "vivarium_public_health.dataset_manager.ArtifactManager"
            builder_interface: "vivarium_public_health.dataset_manager.ArtifactManagerInterface"

components:
    vivarium_public_health:
        mslt:
            population:
                - BasePopulation()
                - Mortality()
                - Disability()
            disease:
                - Disease('CHD')
            intervention:
                - ModifyDiseaseIncidence('reduce_chd', 'CHD')
            observer:
                - MorbidityMortality()
                - Disease('CHD')

configuration:
    input_data:
        # Change this to "mslt_tobacco_maori_20-years.hdf" for the Maori
        # population.
        artifact_path: artifacts/mslt_tobacco_non-maori_20-years.hdf
        input_draw_number: 0
    population:
        # The population size here is the number of cohorts.
        # There are 22 age bins (0-4, 5-9, ..., 105-109) for females and for
        # males, making a total of 44 cohorts.
        population_size: 44
    time:
        start:
            year: 2011
        end:
            year: 2120
        step_size: 365  # In days
    intervention:
        reduce_chd:
            # Reduce the CHD incidence rate by 5%.
            CHD_incidence_scale: 0.95
    observer:
        output_prefix: results/mslt_reduce_chd
Running the model simulation
The above simulation is already defined in mslt_reduce_chd.yaml. Run this
simulation with the following command:
simulate run model_specifications/mslt_reduce_chd.yaml
When this has completed, the output recorded by the
MorbidityMortality observer will be saved in the file
mslt_reduce_chd_mm.csv.
We can now plot the survival of this cohort in both the BAU and intervention scenarios, relative to the starting population, and see how the survival rate has increased as a result of this intervention.
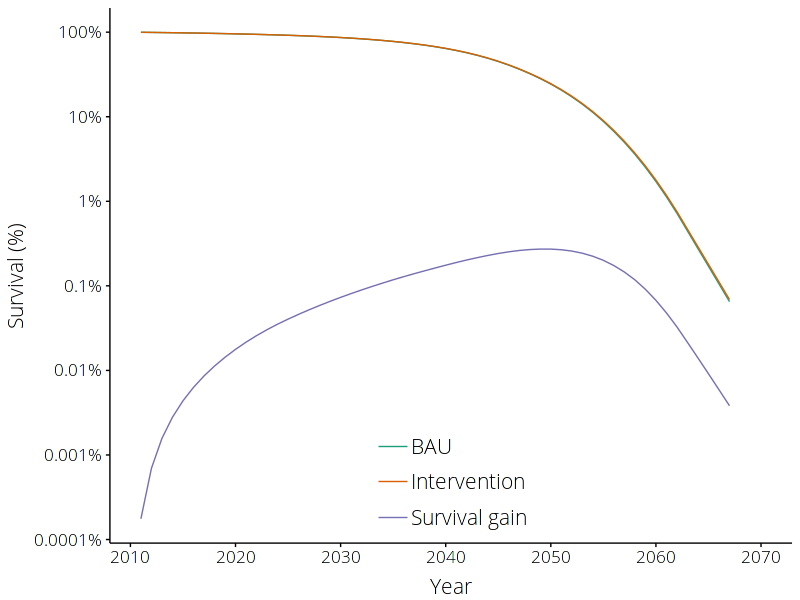
The impact of reducing the CHD incidence rate by 5% on survival rate. Results are shown for the cohort of males aged 50-54 in 2010. Compare this to the impact of reducing all-cause mortality rate by 5%.
The output recorded by the Disease observer will be saved in the file
reduce_chd_disease.csv.
The contents of this file will contain the following results:
Disease |
Year of birth |
Sex |
Age |
Year |
BAU Incidence |
Incidence |
BAU Prevalence |
Prevalence |
BAU Deaths |
Deaths |
Change in incidence |
Change in prevalence |
|---|---|---|---|---|---|---|---|---|---|---|---|---|
… |
||||||||||||
CHD |
1959 |
male |
52 |
2011 |
0.004984 |
0.004735 |
0.03664 |
0.03664 |
0.0 |
0.0 |
-0.000249 |
0.0 |
CHD |
1959 |
male |
53 |
2012 |
0.005339 |
0.005072 |
0.04121 |
0.040955 |
0.6 |
0.6 |
-0.000267 |
-0.000254 |
CHD |
1959 |
male |
54 |
2013 |
0.005698 |
0.005413 |
0.046049 |
0.04553 |
1.2 |
1.2 |
-0.000285 |
-0.000519 |
… |
||||||||||||
CHD |
1959 |
male |
108 |
2067 |
0.038684 |
0.03675 |
0.185506 |
0.18575 |
692.3 |
674.8 |
-0.001934 |
0.000243 |
CHD |
1959 |
male |
109 |
2068 |
0.038684 |
0.03675 |
0.181912 |
0.182606 |
705.3 |
687.8 |
-0.001934 |
0.000695 |
CHD |
1959 |
male |
110 |
2069 |
0.038684 |
0.03675 |
0.178933 |
0.180058 |
717.5 |
700.1 |
-0.001934 |
0.001126 |
… |