The business-as-usual (BAU) scenario
The business-as-usual (BAU) scenario characterises what we expect to occur in the absence of any intervention. It comprises a population that are subject to BAU morbidity and mortality rates, and is the baseline against which we quantitatively evaluate the impact of different interventions.
Defining a simulation
Model simulations are defined by text files that describe all of the
simulation components and configuration settings.
These details are written in the YAML markup language, and the file names
typically have a .yaml extension.
In the intervention example presented below, we provide a step-by-step description of the contents of these YAML files.
In brief, these files will contain three sections:
The
pluginssection, where we load the plugins that allow us to make use of data artefacts;The
componentssection, where we list the simulation components that define the population demographics, the BAU scenario, and the intervention; andThe
configurationsection, where we identify the relevant data artefact, and define component-specific configuration settings and other simulation details.
plugins:
    optional:
        data:
            controller: "vivarium_public_health.dataset_manager.ArtifactManager"
            builder_interface: "vivarium_public_health.dataset_manager.ArtifactManagerInterface"

components:
    vivarium_public_health:
        mslt:
            population:
                - BasePopulation()
                - Mortality()
                - Disability()
            intervention:
                - ModifyAllCauseMortality('reduce_acmr')
            observer:
                - MorbidityMortality()

configuration:
    input_data:
        # Change this to "mslt_tobacco_maori_20-years.hdf" for the Maori
        # population.
        artifact_path: artifacts/mslt_tobacco_non-maori_20-years.hdf
        input_draw_number: 0
    population:
        # The population size here is the number of cohorts.
        # There are 22 age bins (0-4, 5-9, ..., 105-109) for females and for
        # males, making a total of 44 cohorts.
        population_size: 44
    time:
        start:
            year: 2011
        end:
            year: 2120
        step_size: 365  # In days
    intervention:
        reduce_acmr:
            # Reduce the all-cause mortality rate by 5%.
            scale: 0.95
    observer:
        output_prefix: results/mslt_reduce_acmr
Data artefacts
Data artefacts collect all of the required
input data tables into a single file.
The input data files that were used to generate the data artefacts for this
tutorial are stored in the
src/vivarium_unimelb_tobacco_intervention_comparison/external_data/
directory.
If you modify any of the input data files, you can rebuild these artefacts by
running the provided script:
make_artifacts minimal
This will update the follow data artefacts:
mslt_tobacco_maori_20-years.hdf: data for the Maori population, where cessation of smoking results in gradual recovery over the next 20 years.mslt_tobacco_non-maori_20-years.hdf: data for the non-Maori population, where cessation of smoking results in gradual recovery over the next 20 years.mslt_tobacco_maori_0-years.hdf: data for the Maori population, where cessation of smoking results in immediate recovery.mslt_tobacco_non-maori_0-years.hdf: data for the non-Maori population, where cessation of smoking results in immediate recovery.
Intervention: a reduction in mortality rate
In this section, we describe how to use the MSLT components to define a model simulation that will evaluate the impact of reducing the all-cause mortality rate. We then show how to run this simulation and interpret the results.
Note
All of the MSLT components are contained within the
vivarium_public_health.mslt module.
This module is divided into several sub-modules; we will use the
population, intervention, and observer modules in
this example.
Defining the model simulation
Because we are reading all of the necessary input data tables from a preexisting data artifact, we need to load two Vivarium plugins:
plugins:
    optional:
        data:
            controller: "vivarium_public_health.dataset_manager.ArtifactManager"
            builder_interface: "vivarium_public_health.dataset_manager.ArtifactManagerInterface"
We then need to specify the location of the data artifact in the configuration settings:
configuration:
    input_data:
        # Change this to "mslt_tobacco_maori_20-years.hdf" for the Maori
        # population.
        artifact_path: artifacts/mslt_tobacco_non-maori_20-years.hdf
The core components of the simulation are the population demographics
(BasePopulation), the mortality rate (Mortality), and the
years lost due to disability (YLD) rate (Disability).
These components are located in the
population module, and so we identify them as follows:
components:
    vivarium_public_health:
        mslt:
            population:
                - BasePopulation()
                - Mortality()
                - Disability()
We define the number of population cohorts, and the simulation time period, in the configuration settings:
configuration:
    population:
        # The population size here is the number of cohorts.
        # There are 22 age bins (0-4, 5-9, ..., 105-109) for females and for
        # males, making a total of 44 cohorts.
        population_size: 44
    time:
        start:
            year: 2011
We also add a component that will reduce the all-cause mortality rate
(ModifyAllCauseMortality, which is located in the
intervention module)
and give this intervention a name (reduce_acmr).
We define the reduction in all-cause mortality rate in the configuration
settings, identifying the intervention by name (reduce_acmr) and defining
the mortality rate scaling factor (scale):
components:
    vivarium_public_health:
        mslt:
            intervention:
                - ModifyAllCauseMortality('reduce_acmr')

configuration:
    intervention:
        reduce_acmr:
            # Reduce the all-cause mortality rate by 5%.
            scale: 0.95
Finally, we need to record the core life table quantities (as shown in the
example table) at each year of the simulation, by
using the MorbidityMortality observer (located in the
observer module) and specifying the prefix for output
files (mslt_reduce_acmr):
components:
    vivarium_public_health:
        mslt:
            observer:
                - MorbidityMortality()

configuration:
    observer:
        output_prefix: results/mslt_reduce_acmr
Putting all of these pieces together, we obtain the following simulation definition:
plugins:
    optional:
        data:
            controller: "vivarium_public_health.dataset_manager.ArtifactManager"
            builder_interface: "vivarium_public_health.dataset_manager.ArtifactManagerInterface"

components:
    vivarium_public_health:
        mslt:
            population:
                - BasePopulation()
                - Mortality()
                - Disability()
            intervention:
                - ModifyAllCauseMortality('reduce_acmr')
            observer:
                - MorbidityMortality()

configuration:
    input_data:
        # Change this to "mslt_tobacco_maori_20-years.hdf" for the Maori
        # population.
        artifact_path: artifacts/mslt_tobacco_non-maori_20-years.hdf
        input_draw_number: 0
    population:
        # The population size here is the number of cohorts.
        # There are 22 age bins (0-4, 5-9, ..., 105-109) for females and for
        # males, making a total of 44 cohorts.
        population_size: 44
    time:
        start:
            year: 2011
        end:
            year: 2120
        step_size: 365  # In days
    intervention:
        reduce_acmr:
            # Reduce the all-cause mortality rate by 5%.
            scale: 0.95
    observer:
        output_prefix: results/mslt_reduce_acmr
Running the model simulation
The above simulation is already defined in mslt_reduce_acmr.yaml. Run this
simulation with the following command:
simulate run model_specifications/mslt_reduce_acmr.yaml
When this has completed, the output recorded by the
MorbidityMortality observer will be saved in the file
mslt_reduce_acmr_mm.csv.
The contents of this file will contain the following results:
Year of birth |
Sex |
Age |
Year |
Survivors |
BAU Survivors |
Population |
BAU Population |
ACMR |
BAU ACMR |
Probability of death |
BAU Probability of death |
Deaths |
BAU Deaths |
YLD rate |
BAU YLD rate |
Person years |
BAU Person years |
HALYs |
BAU HALYs |
LE |
BAU LE |
HALE |
BAU HALE |
|---|---|---|---|---|---|---|---|---|---|---|---|---|---|---|---|---|---|---|---|---|---|---|---|
… |
|||||||||||||||||||||||
1959 |
male |
52 |
2011 |
129,479.9 |
129,460.4 |
129,850.0 |
129,850.0 |
0.0029 |
0.003 |
0.0029 |
0.003 |
370.1 |
389.6 |
0.1122 |
0.1122 |
129,664.9 |
129,655.2 |
115,112.0 |
115,103.4 |
33.6 |
33.1 |
26.3 |
26.0 |
1959 |
male |
53 |
2012 |
129,087.0 |
129,047.0 |
129,479.9 |
129,460.4 |
0.003 |
0.0032 |
0.003 |
0.0032 |
392.9 |
413.5 |
0.1122 |
0.1122 |
129,283.5 |
129,253.7 |
114,773.3 |
114,746.9 |
32.7 |
32.2 |
25.5 |
25.2 |
1959 |
male |
54 |
2013 |
128,669.3 |
128,607.5 |
129,087.0 |
129,047.0 |
0.0032 |
0.0034 |
0.0032 |
0.0034 |
417.7 |
439.5 |
0.1122 |
0.1122 |
128,878.2 |
128,827.2 |
114,413.5 |
114,368.3 |
31.8 |
31.3 |
24.7 |
24.4 |
… |
|||||||||||||||||||||||
1959 |
male |
108 |
2067 |
192.3 |
136.4 |
303.7 |
220.7 |
0.457 |
0.4811 |
0.3668 |
0.3819 |
111.4 |
84.3 |
0.3578 |
0.3578 |
248.0 |
178.6 |
159.2 |
114.7 |
1.7 |
1.6 |
1.1 |
1.0 |
1959 |
male |
109 |
2068 |
121.7 |
84.3 |
192.3 |
136.4 |
0.457 |
0.4811 |
0.3668 |
0.3819 |
70.5 |
52.1 |
0.3578 |
0.3578 |
157.0 |
110.4 |
100.8 |
70.9 |
1.3 |
1.3 |
0.9 |
0.8 |
1959 |
male |
110 |
2069 |
77.1 |
52.1 |
121.7 |
84.3 |
0.4571 |
0.4812 |
0.3669 |
0.382 |
44.7 |
32.2 |
0.3578 |
0.3578 |
99.4 |
68.2 |
63.8 |
43.8 |
0.8 |
0.8 |
0.5 |
0.5 |
… |
We can examine the impact of this intervention on a single cohort (e.g., non-Maori males aged 50-54 in 2011) by filtering the rows by Year of birth and Sex. We can then plot columns of interest, such as the LE and HALE for both the BAU and intervention scenarios:
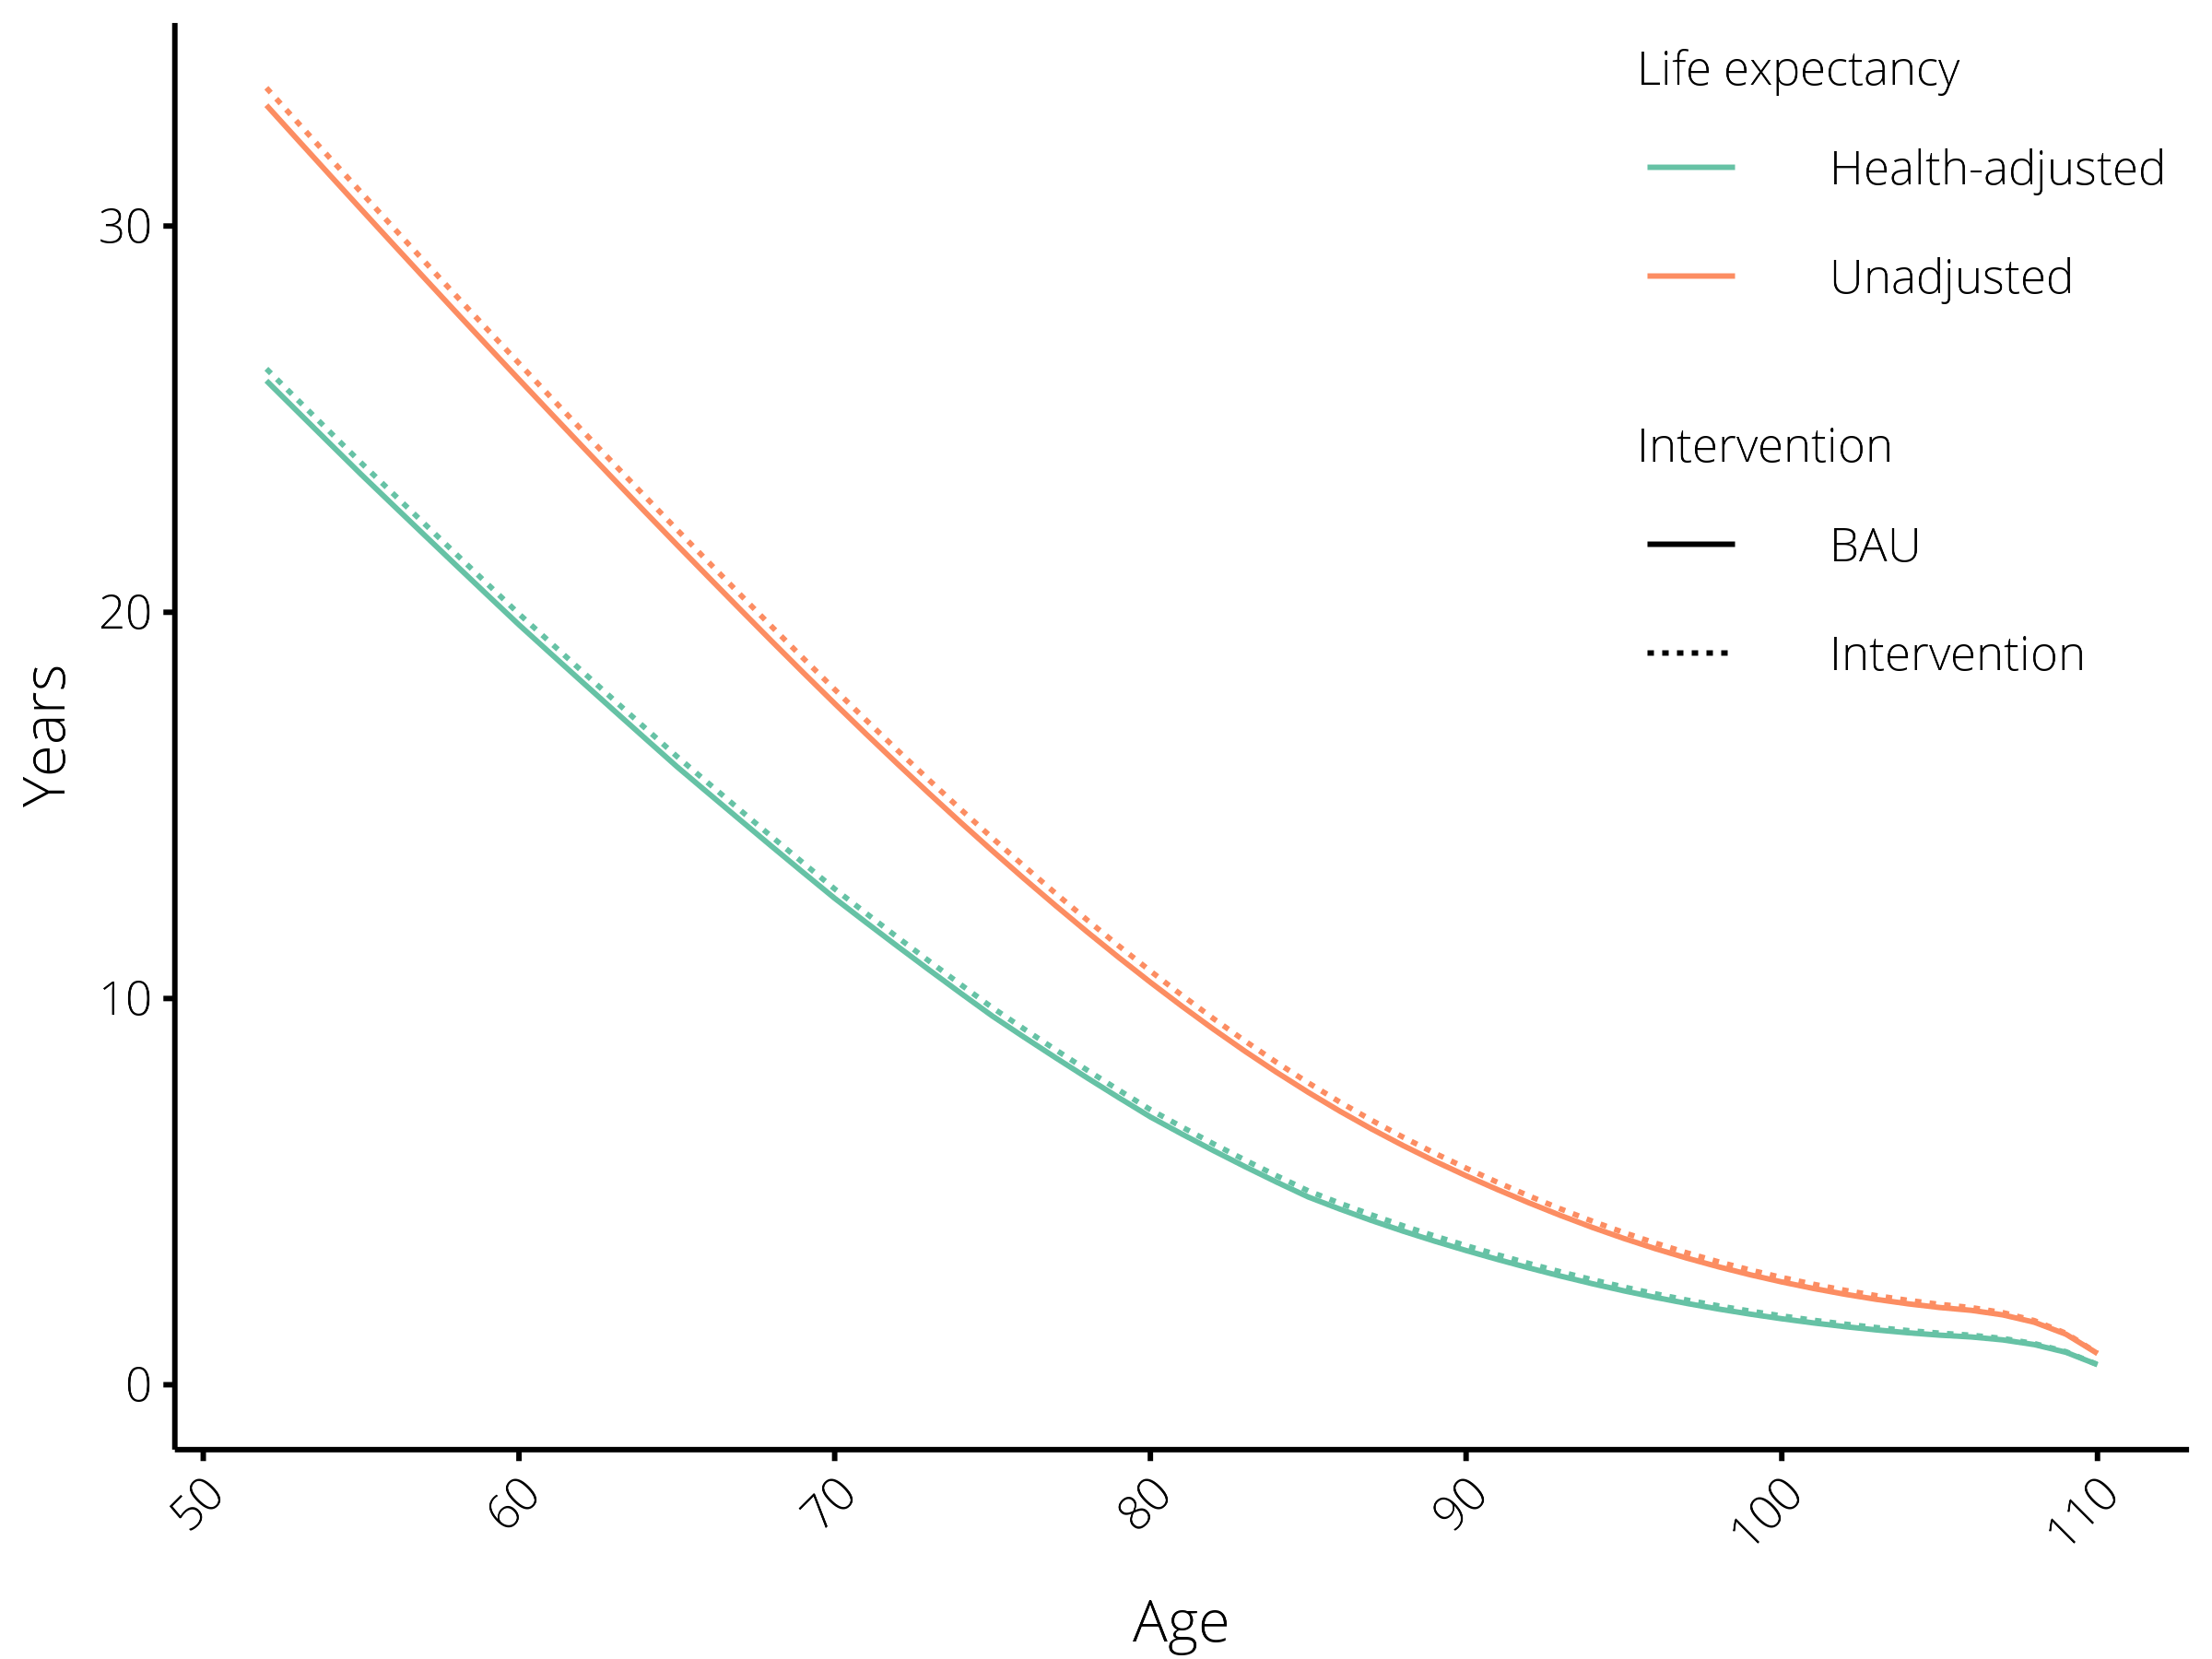
The impact of reducing the all-cause mortality rate by 5% on life expectancy. Results are shown for the cohort of males aged 50-54 in 2011.
With some further data processing, we can also plot the survival of this cohort in both the BAU and intervention scenarios, relative to the starting population, and see how the survival rate has increased as a result of this intervention.
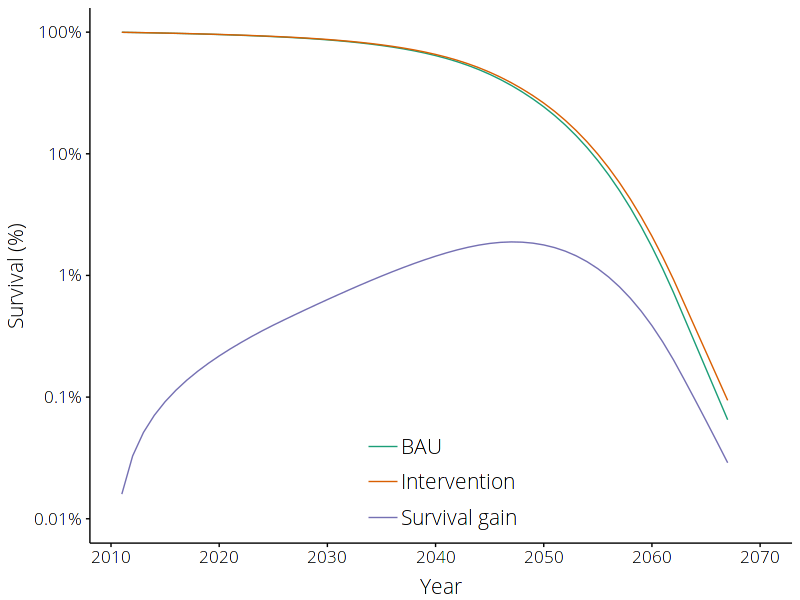
The impact of reducing the all-cause mortality rate by 5% on survival rate. Results are shown for the cohort of males aged 50-54 in 2011.